Soccer is one of the few sports that continues to experience annual popularity growth in the U.S. We’re seeing interest growth not just in major metropolitan cities, but also in smaller secondary markets across the country, which begs the question, what are the top soccer markets?
Welcome to the 2021 GESM Soccer Market rankings. We’ve been publishing our market ranking assessment for several years now and it’s always a study that captures significant attention and fosters much discussion. We’re sure this year’s findings will be no different.
Before presenting the results, let’s talk about why we do these rankings. The sport of soccer is still in its growth phase with increasing television viewing numbers, domestic league and stadia investment, and expanded interest in the women’s game being among the many factors contributing to growth.
With growth comes change and as leaders within the soccer marketing industry, our desire is to help brands and marketers comprehend these changes to assist in making smart marketing decisions. We believe understanding overall soccer engagement across watching, playing, attending, and digital engagement is an important aspect of understanding the larger soccer landscape.
“Americans are watching, attending, playing, and talking about soccer in greater numbers than ever. This isn’t just in the big cities, it’s happening everywhere. As thought leaders, we feel it’s important to help inform brands and marketers on soccer’s national reach and impact.”
John Guppy, GESM President & Founder
Market rankings methodology
In the latest iteration of our rankings, we’ve evolved our approach. Whereas in previous years we focused solely on the top 100 Nielsen designated market areas (DMAs), this time we analyzed all 210 markets to provide ourselves a more holistic perspective. What you’ll see in our publicly-released rankings is the top 50 soccer markets with a population of at least 1 million people.
The data points used to evaluate each market have remained consistent with 17 unique data sets contributing to our calculation. Data sources include Scarbrough, MRI-Simmons, Facebook, SEMrush, and Google to, collectively, provide a cross section view of soccer engagement across four main principles:
- Playing
- Watching
- Attending
- Digital Engagement (Conversing / Searching)
Each data point by market is represented by a percentage of the market’s overall population. To gauge a true appreciation for relative soccer interest by market, it’s important to level the playing field across all markets and not bias the large metropolitan markets like New York and Los Angeles. Every market was ranked from 1 to 210 in each of the 17 categories with a weighting applied to each. Total scores were calculated to determine the overall ranking of each market. The lower the overall score the higher the engagement performance of the market.
One noteworthy acknowledgement is the impact of COVID on certain data points and insights. In the past, we’ve applied equal weighting to each of the core engagement principles. However, many markets had incomplete attendance data in 2020-21 due to local restrictions not permitting fans from in-person viewing. In recognition of this, we reduced the relative weighting applied to attendance data.
Top 50 soccer markets
With all the background info out of the way, let’s get to the most exciting part – the rankings! Here are the top soccer markets in America in 2021 with a population greater than 1 million.
What sticks out to you? Any surprises? To us, one of the most telling insights is the presence of markets with signficant Hispanic and Latino populations. If you isolate the top 10 markets, the Bay Area DMA has the smallest percentage of Hispanics at 19 percent. All other markets have at least a quarter Hispanic and some, like border towns El Paso and Harlingen, are north of 80 percent Hispanic. For reference on Hispanic populations, take a peek at this heat map of the Hispanic population in the U.S. – it’ll come in handy later.
Here are the top 15 markets and their corresponding total weighted rank.
| Rank | Market | Total |
|---|---|---|
| 1 | El Paso, TX (Las Cruces, NM) | 16.9 |
| 2 | Houston, TX | 19.27 |
| 3 | San Francisco-Oakland-San Jose, CA | 19.70 |
| 4 | Los Angeles, CA | 20.03 |
| 5 | San Diego, CA | 20.11 |
| 6 | Dallas-Ft. Worth, TX | 21.78 |
| 7 | Harlingen-Weslaco-Brownsville,McAllen, TX | 21.81 |
| 8 | New York, NY | 22.37 |
| 9 | Chicago, IL | 23.21 |
| 10 | Miami-Ft Lauderdale, FL | 24.43 |
| 11 | Austin, TX | 28.37 |
| 12 | Washington, DC (Hagerstown, MD) | 28.59 |
| 13 | Las Vegas, NV | 30.60 |
| 14 | Providence, RI-New Bedford, MA | 31.16 |
| 15 | Philadelphia, PA | 31.17 |
Mapping out the top soccer markets
To provide additional context of our top markets relative to the entirety of Nielsen’s 210 DMAs, new this year is a heat map of our rankings. All 210 DMAs are outlined and color-coded based on their rank.
The importance and impact of the Hispanic community is clearly seen if you compare our map with the Hispanic population heat map reference above.
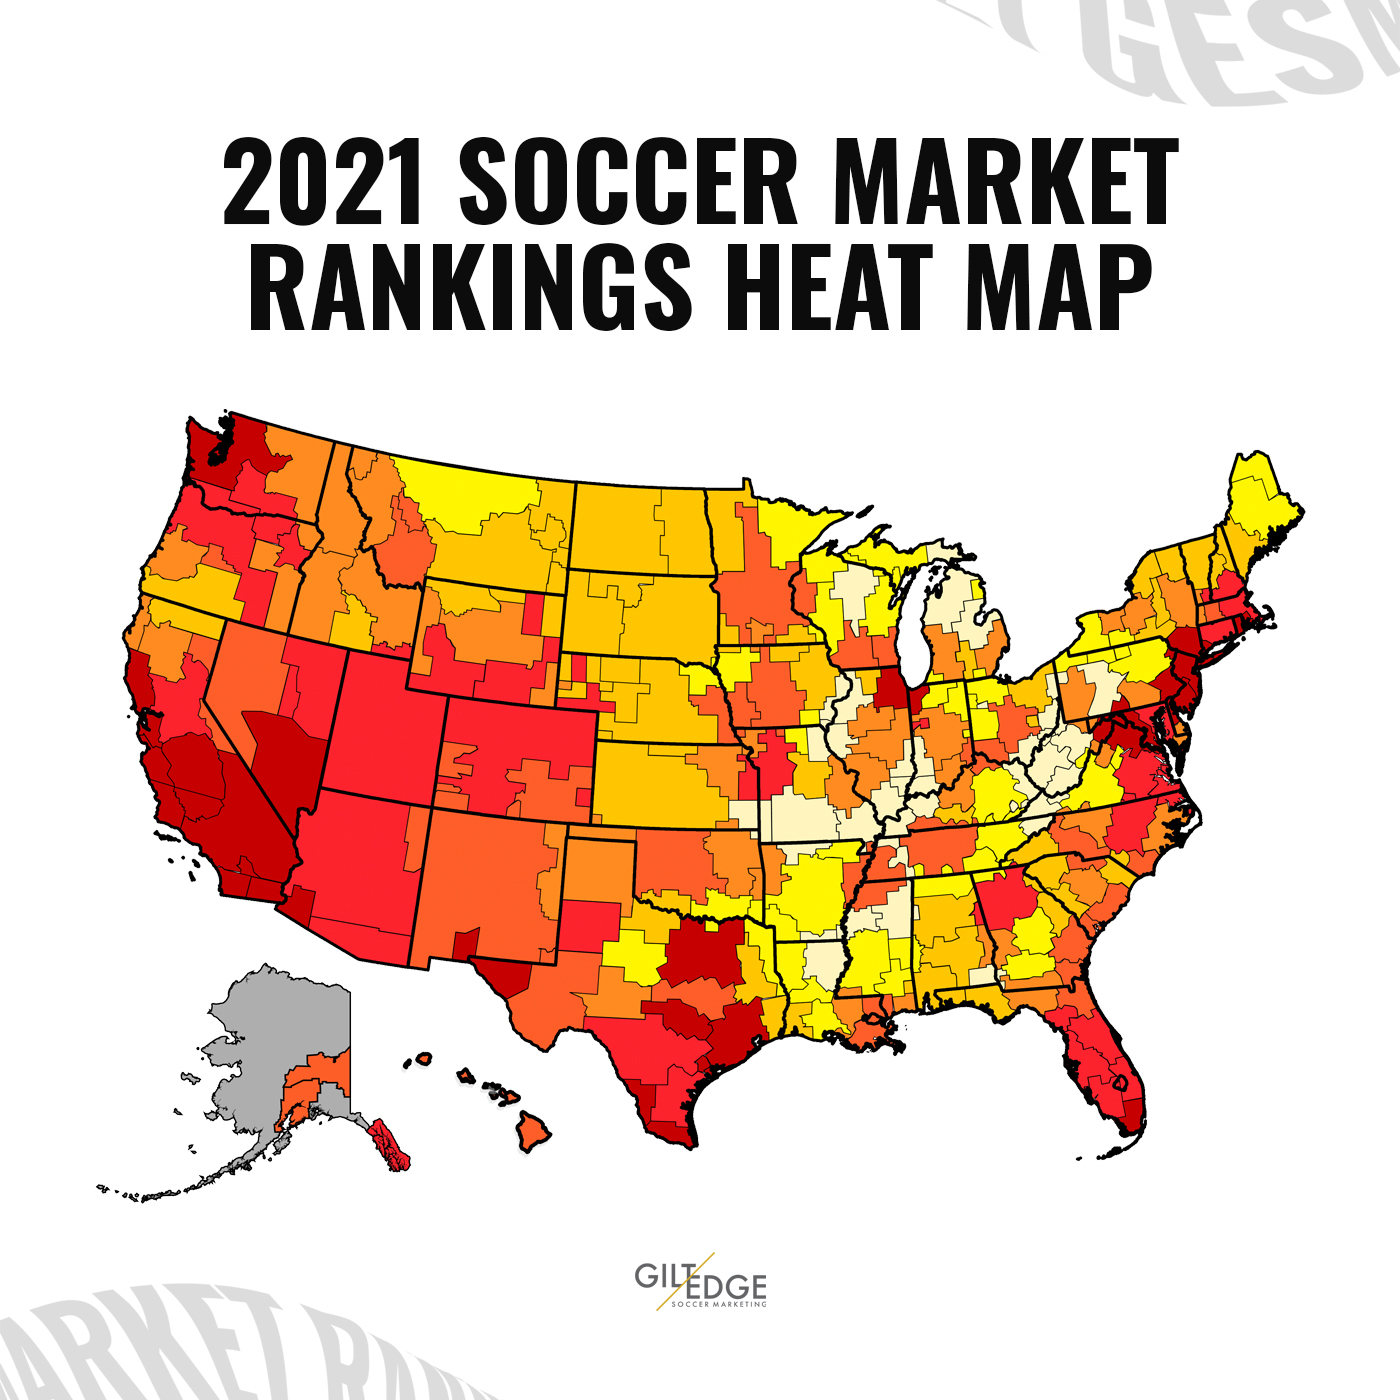
Looking at the map in totality, the hot beds of soccer interest and engagement can be clearly identified. Southern California up through the Bay Area. Seattle and Portland in the Pacific Northwest. Texas and the Southwest border states. South and Central Florida. North Carolina through Virginia and the Mid-Atlantic through the Northeast. Sprinkled elsewhere in the country are important markets like Chicago, Atlanta, Kansas City, Denver, and Salt Lake City.
Final Takeaway
Soccer is a lifestyle sport – a passion that people engage with in many different ways. Existing research sources focus solely on ranking markets by a singular data point like TV ratings for the FIFA World Cup, attendance data across MLS and USL, or number of registered youth players. Comparing the relative interest by market across all aspects is a difficult exercise.
Our desire – and the purpose of these market rankings – is to look at soccer interest more holistically and embrace the four principles of watching, attending, participating, and digital engagement. The data points are all from respected third parties and our methodology is based purely on the application of math to ensure we avoid any perspective bias. We hope you find these insights valuable.
As we look to update this research initative in a few years, it will be interesting to see how the rankings and the map change. We expect to see several more markets shaded orange and red, especially as we approach the 2026 FIFA World Cup to be held in many of these markets.
Categories: Feature, Featured, Infographics, Research